Reducing cost does not mean making a weaker makeup brush. It means removing waste while protecting performance, safety, and user trust. This 2026 guide explains how to reduce makeup brush production costs through smarter materials, controlled sampling, and reliable supplier management.
Sam Chapman, professional makeup artist and Real Techniques co-founder, captures the core principle: “Good tools should serve the artist, not slow them down.” That idea applies directly to manufacturing. A softer filament is not automatically better. The correct fiber depends on the brush shape, application purpose, shedding resistance, and target price. Nylon, synthetic taklon, and mixed fibers each create different cost and quality results.
Small leaks matter. A factory may save on bristles but lose money through uneven trimming, loose ferrules, damaged handles, or oversized packaging. This guide examines every cost point, including material selection, mold design, minimum order quantities, labor, inspection, packaging, and freight. It also shows how to compare quotations without choosing the cheapest supplier blindly. Production records, defect rates, sample approvals, and batch testing provide stronger evidence than promises.
The process is not perfectly predictable. A lower-cost handle may crack during transport. A cheaper adhesive may increase shedding after washing. These mistakes deserve attention, not excuses. Perfection is expensive, but careless shortcuts cost more. By combining technical specifications with real production feedback, brands can reduce waste, negotiate with confidence, and build brushes that remain dependable on a crowded 2026 market.
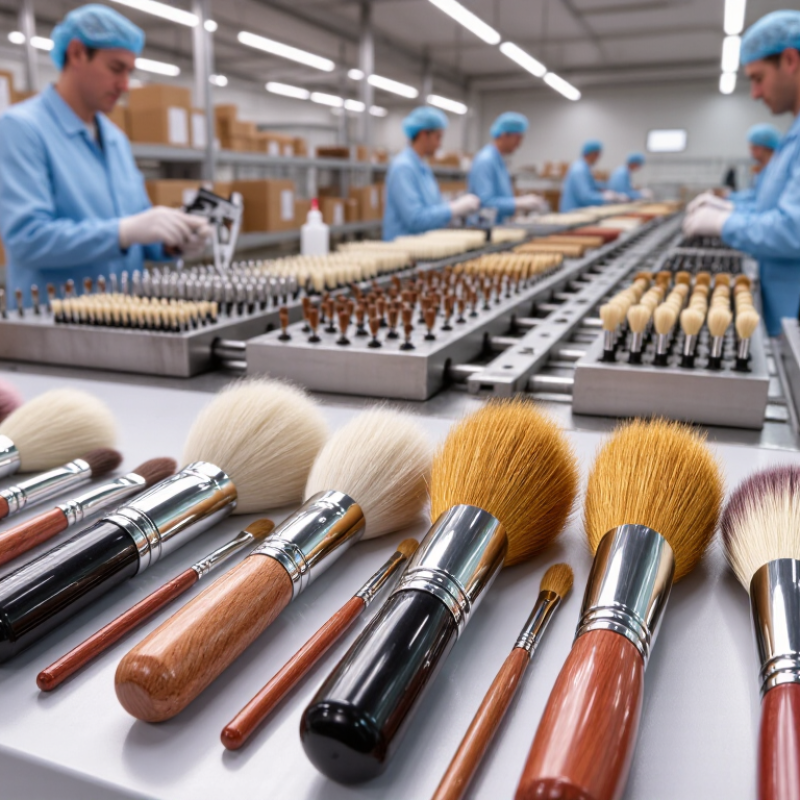
Reducing makeup brush costs starts with defining where money actually goes. The largest drivers are materials, labor, tooling, quality control, and logistics. Bristle selection matters immediately. Synthetic fibers can offer stable sizing, while natural hair may require stricter sorting and higher rejection rates. Handle material also changes costs. A painted wood handle needs coating, drying space, and inspection. Molded plastic may reduce variation but require mold investment. Small choices multiply across thousands of units.
Labor is often underestimated. A brush may pass through trimming, shaping, gluing, assembly, polishing, and packing. Each manual touch adds minutes. Inconsistent glue application can create loose ferrules or shedding. In production reviews, the most useful comparison is cost per acceptable brush, not cost per assembled brush. A low unit quote can hide rework, scrap, and delayed shipments. Track defect rates by process. Use sample batches before committing to a large run.
Tooling and packaging deserve separate attention. A custom ferrule or unusual handle profile can increase mold fees and setup time. Standard dimensions often shorten production time, though they may limit visual differentiation. Packaging can consume surprising budget through inserts, cartons, and protective sleeves. Freight depends on volume, weight, and delivery urgency. Early estimates may be too optimistic when packaging dimensions are ignored. That mistake is worth remembering. Review actual yields, labor minutes, inspection results, and shipping data before approving the final price.
Reducing makeup brush costs starts with material engineering, not simple price cutting. McKinsey’s 2023 beauty report projects the global beauty market may reach about $580 billion by 2027. That growth increases pressure on manufacturers to protect margins without weakening performance. Synthetic PBT or nylon fibers can provide consistent shape, low shedding, and easier batch control. Recycled aluminum ferrules may reduce virgin material use while keeping firm compression. FSC-certified wood handles can also support responsible sourcing, but moisture testing remains essential. A beautiful handle is useless if it swells after cleaning.
Material selection must match the brush’s job. Dense foundation brushes need resilient fibers and secure ferrule crimping. Softer powder brushes may use fewer fibers without losing comfort. Laboratory checks should include shedding after repeated washes, fiber recovery, odor, color transfer, and handle torque. PwC’s 2024 Voice of the Consumer Survey reports that 46% of consumers are willing to pay more for sustainably produced goods. However, recycled content does not automatically justify a higher price. Sometimes it creates inconsistent texture. That deserves honest review.
Tips: Build two prototypes before mass production. Compare fiber weight, pickup, wash durability, and assembly time. Track defects by material batch. The cheapest option is not always the lowest-cost product. I would still challenge every “premium” component that lacks measurable performance data.
Select Cost-Efficient Materials Without Sacrificing Product Quality
This planning benchmark compares common makeup brush material options using a normalized material-cost index, where synthetic nylon is set at 100. Synthetic PBT and nylon generally provide a lower-cost alternative to natural animal hair while offering consistent shape retention, easy cleaning, and scalable production. Aluminum ferrules and molded plastic handles can further reduce weight and assembly costs compared with brass ferrules and solid wood handles.
2026 Top Guide: How to Reduce Makeup Brush Production Costs?
Streamline Brush Design, Components, and Manufacturing Processes
Reducing makeup brush costs starts with a simpler, measurable design. Use one handle shape across several brush sizes when possible. This reduces tooling changes, packing variations, and assembly time. Keep ferrule dimensions consistent. A 0.5-millimeter adjustment can affect crimping pressure and reject rates.
Choose materials according to performance, not appearance alone. Recycled plastic handles may reduce material costs, but they require stable moisture control during molding. Aluminum ferrules offer a clean finish, yet thinner walls can dent during transport. Test both options with drop tests, pull tests, and repeated washing. Real use reveals weaknesses.
Our first costing model was wrong. We underestimated manual trimming and added inspection time later. That mistake mattered. Now, production teams measure fiber waste at every filling station. They also use pre-cut fiber bundles and simple alignment guides. These changes reduce handling without sacrificing softness or shape retention. However, excessive automation can create new defects. Small batches should still receive manual checks for uneven tips, loose ferrules, and adhesive marks.
Work with manufacturers that document tolerances, batch records, and corrective actions. Request pilot runs before confirming large quantities. Compare actual cycle times with quoted estimates. Review packaging dimensions too. A smaller carton can lower shipping volume, but compressed brush heads may arrive misshapen. Cost reduction should protect usability, consistency, and customer safety.
| Cost Area | Production Decision | Typical Baseline | Cost-Reduction Action | Indicative Saving Potential | Operational Effect | Quality Control Point |
|---|---|---|---|---|---|---|
| Brush Design | Reduce unnecessary brush variants | Multiple handles, ferrules, and sizes for similar applications | Use a modular platform with shared handle diameters and ferrule sizes across compatible brush types | 5%–12% of tooling and component costs | Lower tooling count, simpler purchasing, and improved production scheduling | Confirm that the shared components preserve balance, grip comfort, and application performance |
| Brush Design | Optimize overall brush dimensions | Oversized handles or ferrules that add material without improving use | Reduce handle length, wall thickness, or ferrule height after ergonomic and strength testing | 3%–8% of material weight | Lower resin, wood, metal, packaging, and freight consumption | Perform drop, torque, bending, and repeated-use tests before approving the change |
| Components | Standardize ferrule materials and finishes | Several metal thicknesses, plating colors, and surface treatments | Limit the range of ferrule gauges and select one or two high-volume finishes | 4%–10% of ferrule purchasing cost | Higher order volumes and fewer setup changes for stamping and finishing | Check corrosion resistance, plating adhesion, edge safety, and color consistency |
| Components | Match bristle specification to application | Uniformly high-grade or high-density fiber fill for every brush type | Use different fiber diameters, taper profiles, and fill weights according to product function | 6%–15% of fiber and fill-material cost | Reduces over-specification while maintaining powder pickup or liquid distribution | Measure shedding, softness, spring-back, shape retention, and application coverage |
| Components | Increase shared component purchasing volumes | Small orders spread across many custom components | Consolidate forecasts and purchase common fibers, handles, and ferrules in planned batches | 3%–10% of component purchase price | Improves supplier capacity planning and reduces minimum-order pressure | Use incoming inspection and approved samples to prevent lot-to-lot variation |
| Manufacturing | Control fiber filling and trimming precision | Manual filling, repeated trimming, and high operator adjustment rates | Use calibrated filling weights, standardized molds, trimming guides, and first-piece approval | 8%–18% of direct labor and rework cost | Shorter cycle times, more consistent shapes, and fewer rejected pieces | Track fill weight, finished length, profile symmetry, and shedding by production lot |
| Manufacturing | Improve adhesive application | Excess adhesive, inconsistent mixing, or uncontrolled curing time | Meter adhesive volume, define mixing ratios, and standardize curing conditions | 2%–6% of material and rework cost | Less adhesive waste and fewer loose-fiber or ferrule-separation defects | Verify bond strength, curing time, odor, and compatibility with the handle material |
| Manufacturing | Reduce changeover frequency | Frequent production switches between similar designs and finishes | Group orders by handle color, ferrule finish, fiber type, and brush size | 5%–15% of setup and idle-time cost | Higher equipment utilization and fewer cleaning or calibration interruptions | Use line-clearance procedures to prevent mixed components and incorrect labeling |
| Quality and Yield | Move inspection earlier in the process | Defects discovered mainly during final inspection or packing | Add checkpoints after fiber preparation, ferrule assembly, adhesive curing, and shaping | 10%–25% reduction in avoidable rework | Prevents defective semi-finished goods from receiving additional labor and packaging | Record defect codes, first-pass yield, rework rate, and scrap rate by process step |
| Packaging and Logistics | Optimize retail and shipping packaging | Individually oversized boxes or excessive protective inserts | Use right-sized cartons, common pack counts, and protective sleeves only where needed | 5%–15% of packaging and freight volume cost | More units per master carton and lower dimensional shipping weight | Validate compression, vibration, drop, moisture, and bristle-shape protection |
| Supply Planning | Balance order quantity and inventory exposure | Very small batches with frequent expedited replenishment | Use demand forecasts, safety-stock limits, and scheduled releases for common components | 3%–8% of procurement and expedited-freight cost | Reduces rush fees while avoiding excessive obsolete inventory | Review forecast accuracy, inventory turns, supplier lead time, and component shelf life |
| Process Management | Document standard work instructions | Operator-dependent methods and inconsistent setup parameters | Create visual work instructions for filling, gluing, assembly, trimming, inspection, and packing | 2%–7% of labor and defect-related cost | Shortens training time and improves repeatability across shifts | Audit process parameters, operator training records, and revision control |
| Planning note: The saving ranges are non-company-specific manufacturing benchmarks for internal budgeting. Actual results depend on order volume, brush construction, material specifications, labor rates, automation level, quality requirements, tooling condition, and supplier terms. Savings percentages should not be added directly because several actions affect the same cost base. | ||||||
Reducing makeup brush production costs starts with supplier management, not cheaper materials. Deloitte’s 2023 Global Chief Procurement Officer Survey reports that 74% of procurement leaders prioritize cost management. For brush makers, this means comparing suppliers through total cost, not unit price alone.
Review fiber consistency, ferrule strength, handle coating, defect rates, payment terms, and delivery reliability. A supplier offering a $0.08 lower price may create higher costs through rework and late shipments.
Requesting pre-production samples and quarterly process audits can expose these risks early. Small batches help.
Order volume also requires discipline. McKinsey’s 2022 global supply chain survey found that 92% of companies had changed their supply-chain footprints since 2020. This reflects a practical lesson: depending on one source or one oversized order is fragile.
Use demand history, seasonal sales, and minimum order quantities to set a rolling purchasing plan. Larger orders may reduce material and freight costs, but excess inventory can tie up cash and age in storage.
A 60-day safety stock may be reasonable for stable styles, but not for trend-driven colors or new shapes. Forecasting is never perfect.
Quality control should be measured at three points: incoming materials, assembly, and final packing. Use sampling plans based on ISO 2859-1, with clear acceptance limits for shedding, loose ferrules, uneven trimming, odor, and handle scratches.
Record defect data by supplier and production lot. Do not inspect only finished cartons. That approach looks efficient, but it hides process failures until correction becomes expensive.
Some controls will feel excessive. They may still protect margin.
2026 Top Guide: How to Reduce Makeup Brush Production Costs?
Measure Savings and Improve Production Efficiency Over Time
Reducing makeup brush costs requires more than negotiating lower material prices. Track each production batch using clear metrics: material cost per brush, labor minutes, scrap rate, rework rate, and daily output. A simple spreadsheet can reveal where money disappears. For example, a high bristle rejection rate may cost more than a slightly expensive supplier. Record baseline results for four weeks before changing the process. Early data may be untidy. That is normal.
Tips: Photograph defects, weigh material waste, and compare planned output with actual output each shift. Review the figures weekly, not only at month-end. Small changes matter. Adjust adhesive quantities, standardize trimming pressure, and check ferrule alignment before final assembly. These actions can reduce rework while protecting brush shape and durability. Supervisors should verify samples from every batch, especially after changing materials or equipment. A short inspection log creates useful evidence for future decisions.
Measure improvement with the same method every month. Calculate savings against the original baseline, not against last week’s unusually poor result. Track production speed alongside quality scores, because faster output is not efficient when returns increase. A practical target might be reducing scrap by 5% while maintaining the same softness and handle strength. Review worker feedback as well. Operators often notice vibration, uneven coating, or tool fatigue before reports show a pattern. Some improvements will fail. Document why, then refine the process instead of hiding the result.
Use one handle shape across several brush sizes. Keep ferrule dimensions consistent. Fewer tooling changes save time and packing space.
Test handles, ferrules, and fibers with drop tests, pull tests, and repeated washing. Appearance alone can mislead. Real use exposes weak points.
Measure waste at every filling station. Use pre-cut fiber bundles and alignment guides. Do not automate everything. Small batches still need manual checks.
Check uneven tips, loose ferrules, adhesive marks, shedding, odors, and scratches. Inspect incoming materials, assembly, and final packing. Finished cartons are not enough.
Compare total cost, not unit price alone. Review defect rates, delivery reliability, payment terms, and material consistency. A cheaper unit may create costly rework.
Use demand history, seasonal sales, and minimum order quantities. Larger orders may lower freight costs. Excess stock can age in storage and tie up cash.
Track material cost, labor minutes, scrap rate, rework rate, and daily output. A basic spreadsheet can reveal hidden losses. Early data may look untidy.
Record baseline results for four weeks before changing the process. Compare monthly results with that baseline. Do not celebrate faster output if returns increase.
Document the failure and identify its cause. Review worker feedback, defect photos, and waste weights. Some ideas fail. That is useful evidence.
Reducing makeup brush production costs requires a clear understanding of the factors that influence total expenses, including materials, labor, manufacturing complexity, packaging, quality control, and logistics. This guide explains how to reduce makeup brush production costs without compromising product performance or customer expectations. It focuses on selecting durable, cost-efficient fibers, handles, ferrules, and packaging materials while maintaining comfort, appearance, and usability. Simplifying brush shapes, reducing unnecessary components, and improving production workflows can also lower waste and shorten manufacturing time.
Effective supplier management is equally important. Businesses can compare quotations, negotiate realistic order volumes, consolidate shipments, and establish consistent quality standards to improve cost efficiency. Regular inspections help prevent defects, returns, and rework that may increase expenses. Finally, tracking material usage, defect rates, production time, and total unit costs enables continuous improvement. By reviewing these measurements over time, manufacturers can identify new savings opportunities while maintaining stable quality and reliable production performance.

Exio Beauty